DATA VIZ, INFOGRAPHICS, ILLUSTRATION
Below is a selection of static visuals. To see more graphs, charts, videos and GIFs, please visit my multimedia page.
To see a selection of climate cartoons, please visit my cartoons page.

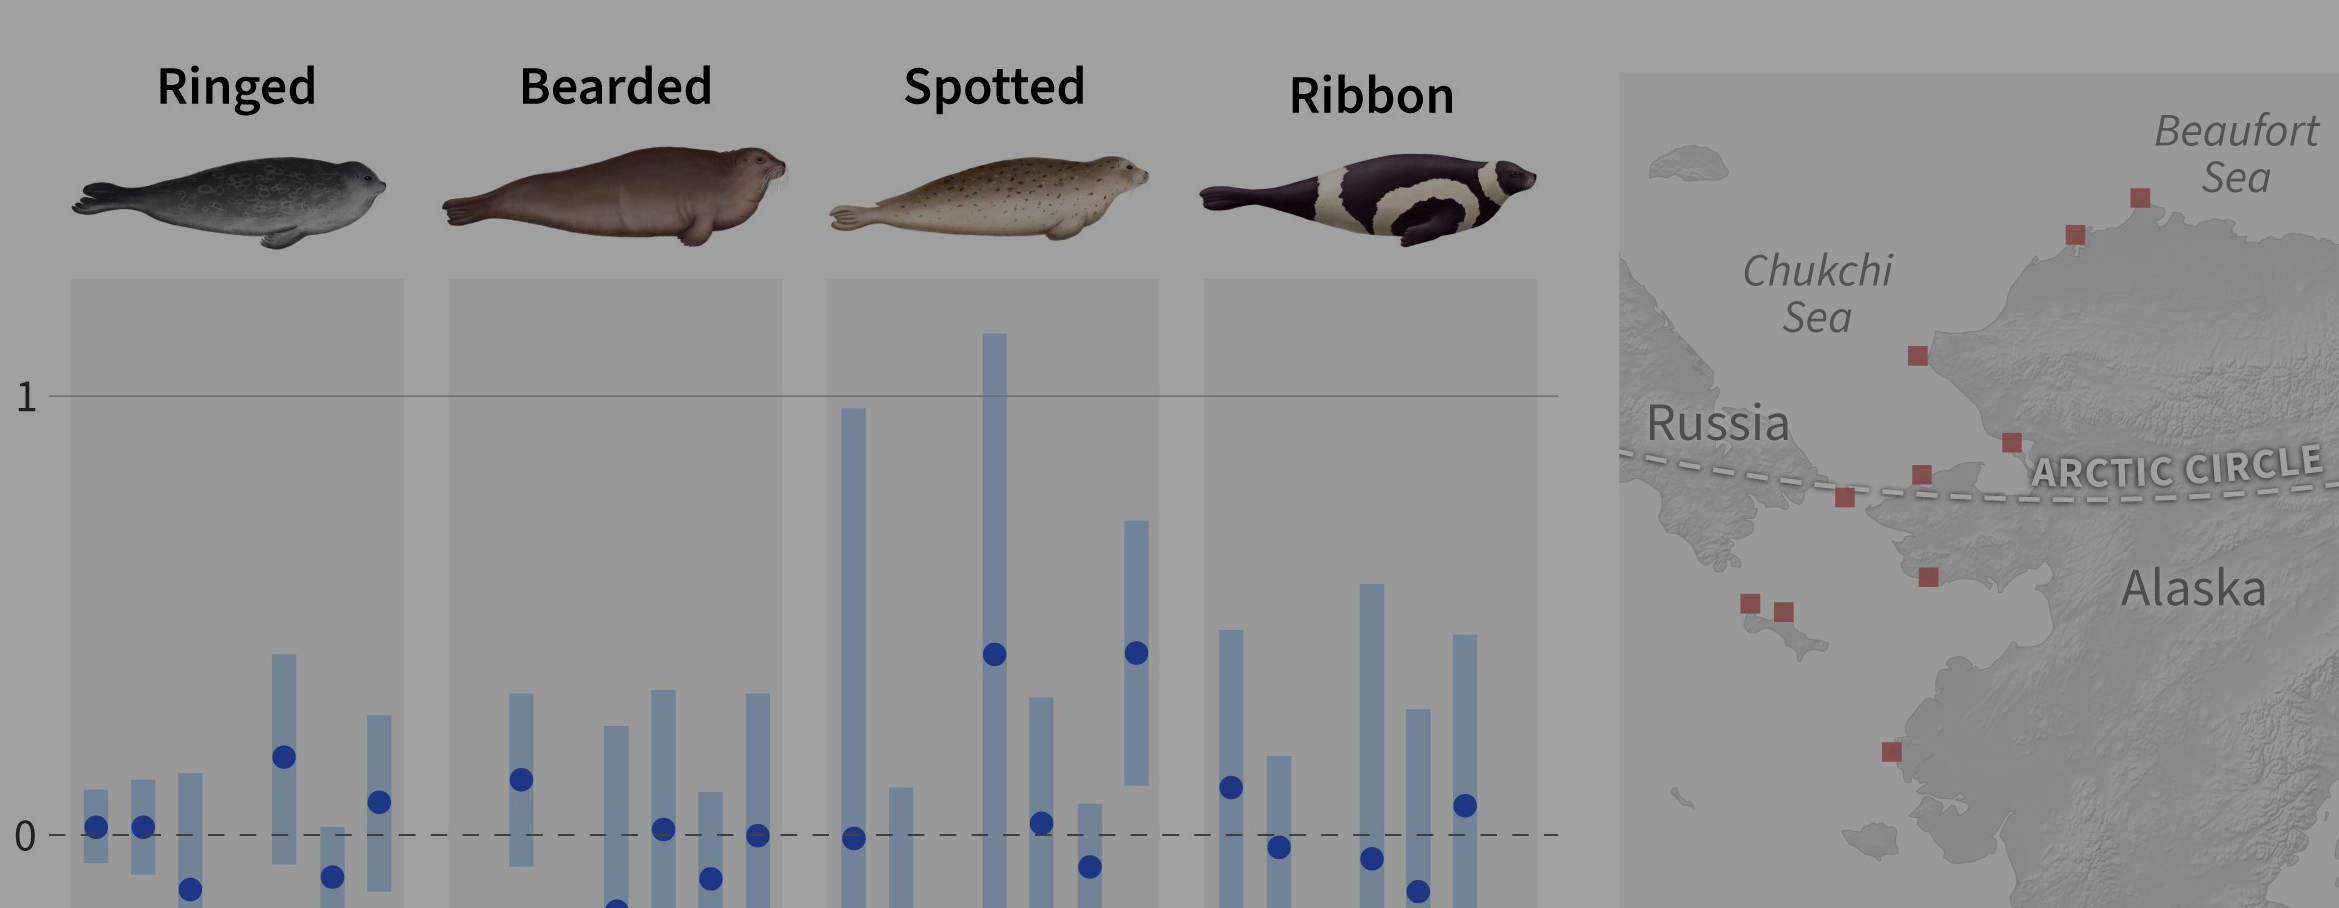
Produced with NOAA Climate.gov for the 2024 Arctic Report Card. Illustrations, cartography, chart design, layout.
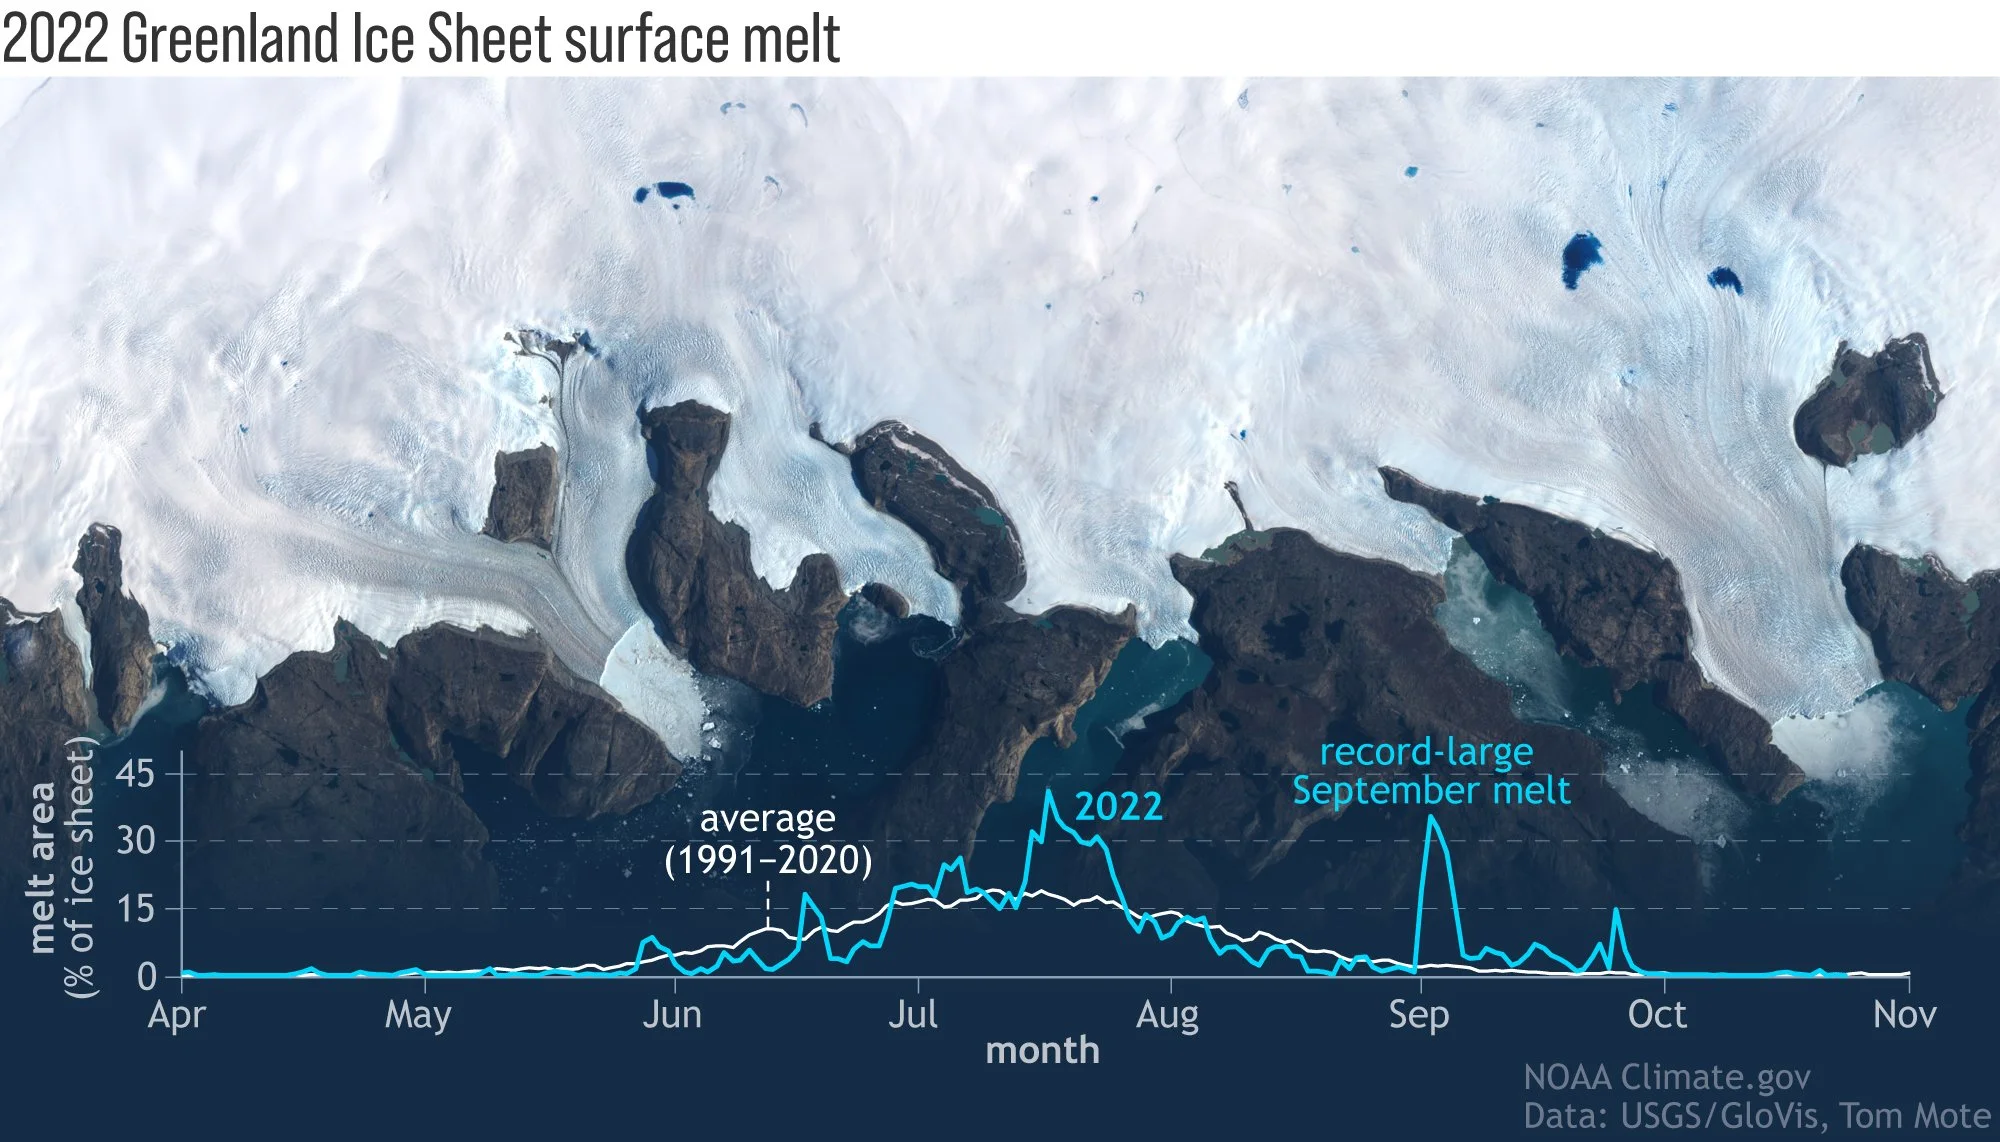
Produced with NOAA Climate.gov for the 2022 Arctic Report Card. Chart design, photo research, layout.


Graphics created for the article What are teleconnections? Connecting Earth's climate patterns via global information superhighways published on NOAA Climate.gov.


Illustration and design for a full-page visual included in The Atlas of a Changing Climate published by Timber Press. I worked with the author to reproduce the central map and inset, as well as create custom illustrations for select species placed within a simple ocean/landscape for context. This is a digitally colored pencil drawing.

Graphic created for NOAA Climate.gov.
Graph animation created with Climate.gov using After Effects and Adobe Illustrator.

30 Year Timeline for Equal Exchange, a worker-owned co-operative that distributes fairly traded and organic coffee, tea, chocolate, and other foods using ingredients grown by small farmers around the world. Working with content written for their 2016 Annual Report, I created a visual story of the successes, failures, and relevant world events that Equal Exchange encountered during the last 30 years using provided imagery.

Graphic created for Climate.gov. adapted from Kroeger, K.D., Crooks, S., Moseman-Valtierra, S. et al. Restoring tides to reduce methane emissions in impounded wetlands: A new and potent Blue Carbon climate change intervention.

Visual showing the relationship between temperature and moisture. Illustration based on a concept by LuAnn Dahlman for NOAA Climate.gov.

Graphic created for Climate.gov.

Graphic designed and illustrated for NOAA’s Climate Program Office.


Graphics produced with the NOAA Climate.gov team for a paper in a Nature Partner Journal njp Climate and Atmospheric Science.

Charts and layout for the inside cover of the 2019 Equal Exchange annual report. Illustration assets provided by the Equal Exchange creative team.

Updated color palette, typography, and styling for a chocolate tasting wheel originally created for liquor tasting at New England Chocolate Festival in 2018 (Meaghan Holmes). Created for Equal Exchange.
Ozone hole animation created with Climate.gov using Adobe Photoshop, Illustrator, and After Effects.

Created with the team at Climate.gov. Project management, concept development, illustration, collaboration, production.

Illustrations developed for the NOAA Greenhouse Gas (GHG) Monitoring & Services landing page.
Hand drawn elevation profile showing a 5-night backpack around Mount Rainier. View the full map »
Charts and graphs created for Nature’s Temples and The Gardener’s Guide to Weather and Climate published by Timber Press.

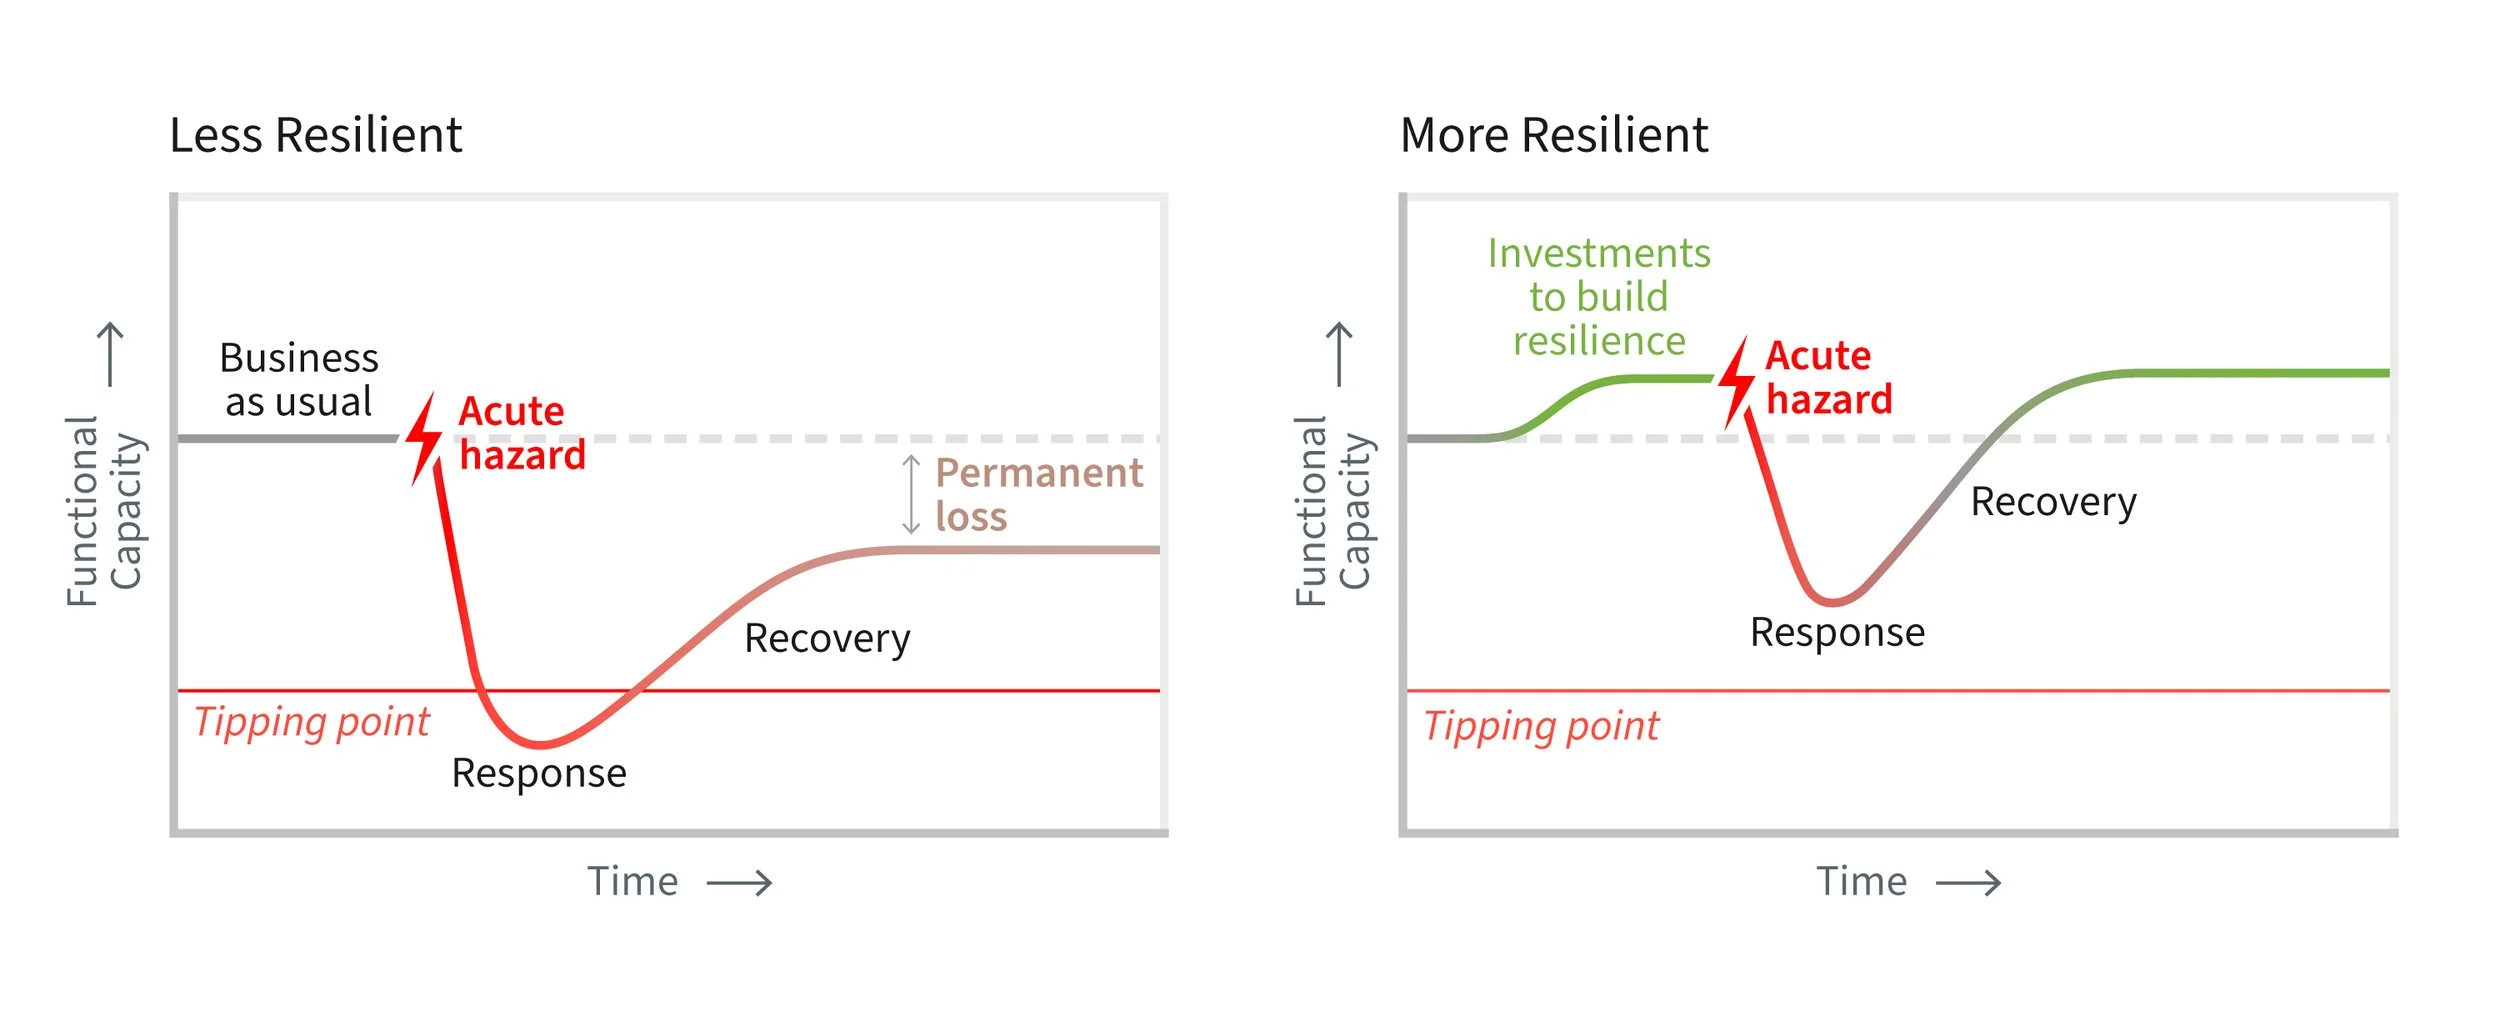

Graphics created for Implementing the Steps to Resilience: A Practitioner’s Guide. See the full publication here.

Concept for a roots-to-fruits diagram.
View information designs in motion on my multimedia page.
INFOGRAPHICS & DESIGN
Be in touch if you’d like to work together.
